Energy: Enegy represents the state of the organ’s energy level (explained later in the manual)
Optimum Dispersion (OD): Shows cellular level function in numerical representation. Allows prioritizing of analysis sequence based on lowest OD of organs and tissues which mean disruption in cellular level function
They are all used for initial analysis of the research results.
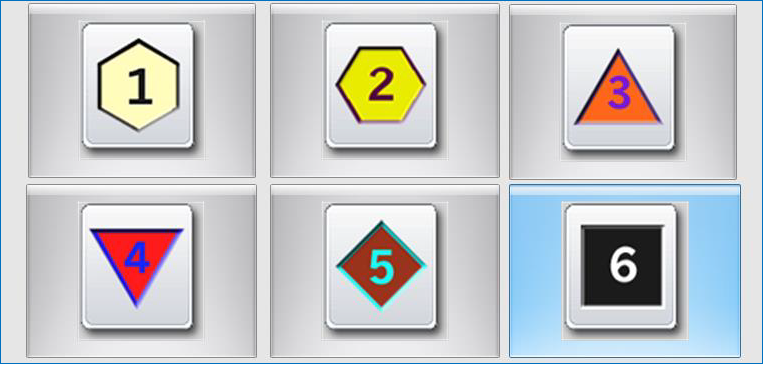
Energy Levels:
Energy levels 1-3 are NORMAL HEALTH/ENERGY indicators
Energy level 4 indicates BEGINNING STAGE of potential illness/imbalance
Energy level 5 indicates a possible ACUTE problem/low energy
Energy level 6 indicates a CHRONIC imbalance/low energy
GREEN color means that within that organ you will only find energy levels 1-4
RED color means that within that organ you will find at least one energy level 5
PURPLE means that within that organ you will find at least one energy level 6
The darker the color the lower the energy level found in that organ/tissue
OD Value:
OD values below 1.200 should be the priority focus.
OD values below 0.900, 0.700 etc. are of MOST priority and indicate areas of root cause. In this example, we have a high energy and low cellular level function. This means the energy in the organ is doing ok but within the cellular structure of the organ there are important imbalances.
We should check the Energy and OD value together:
If the OD value is over 1.200 and the Energy is high (Green), means this item is good, that you don’t need to do advanced analysis
If the OD value is under 1.200 or the Enegy is low (Red, Purple), means that you need go to the analysis page to do advanced analysis (we suggest you can do Entropy analysis and NLS analysis)
SIGNUP FOR OUR NEWSLETTER
Subscribe free newsletter to get latest products and discount information.

 GREEN color means that within that organ you will only find energy levels 1-4
 RED color means that within that organ you will find at least one energy level 5
 PURPLE means that within that organ you will find at least one energy level 6